
Table of Contents
Download Planning for a New Northeast Corridor:
Download The Hudson Terminal Plan:
Download the Trends & Opportunities Report:
Amtrak’s Business Structure
Amtrak, as a business, wears many hats and is engaged in many separate enterprises. It is the operator of both highly profitable and unprofitable intercity rail lines alike. It builds and maintains infrastructure for some of its routes, and leases tracks maintained by freight railroads for other routes. For some sectors, increased success results in increased profitability. For other sectors, the opposite occurs. Because Amtrak is the only intercity passenger rail system in the nation, and because its mission and organizational structure are controlled by Congress, financial and operational success is extremely challenging, if not impossible.
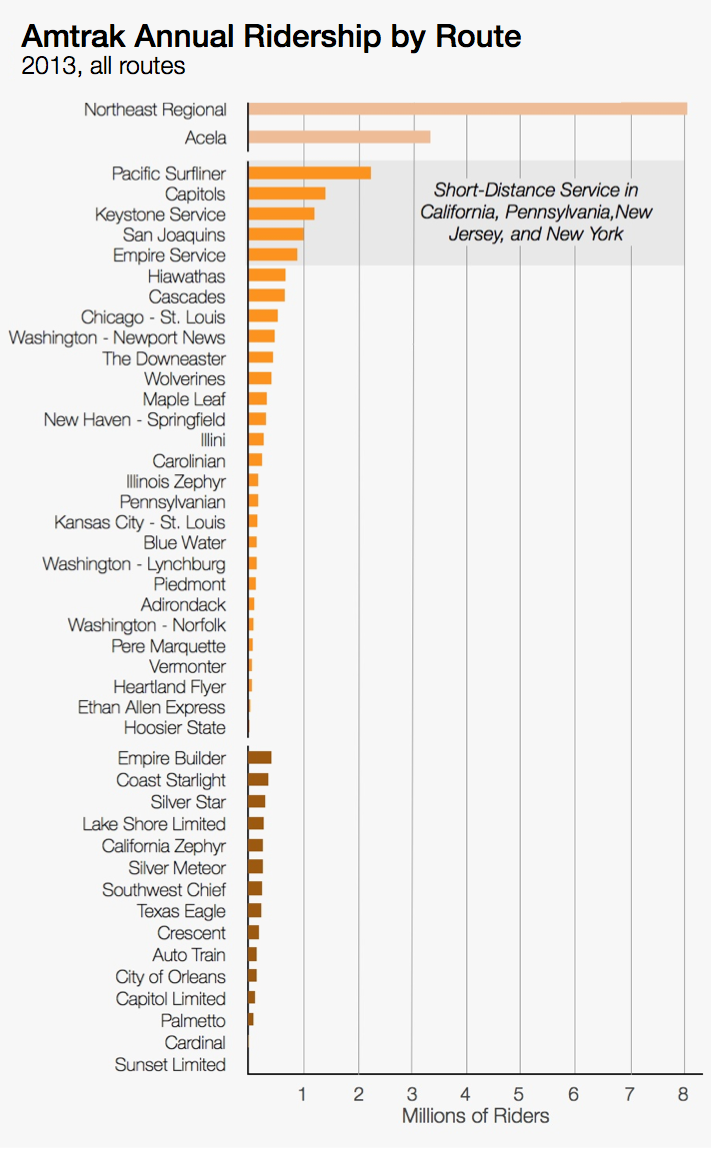
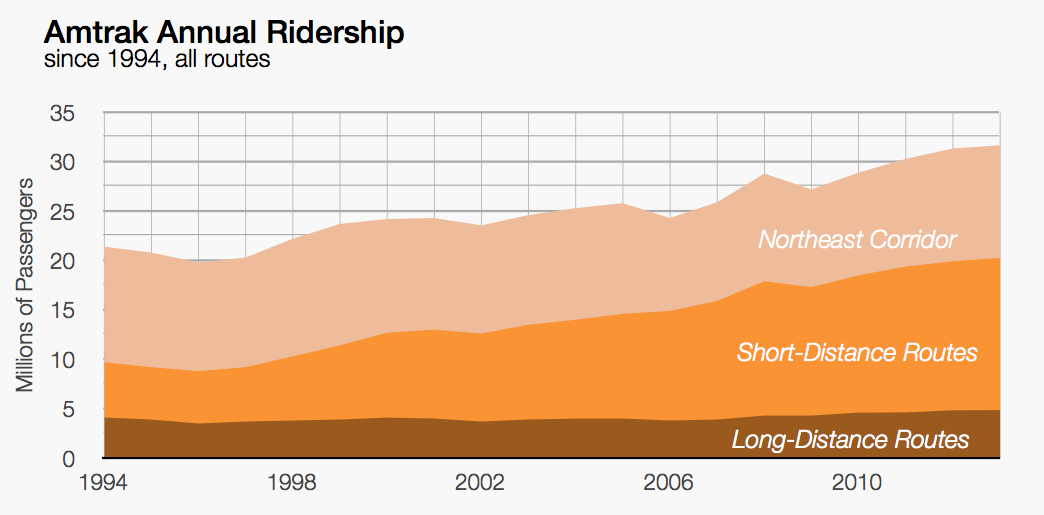
In terms of passenger service, Amtrak operates three key sectors: the Northeast Corridor including the Acela Express and Northeast Regional service, 28 state-supported short-distance routes, and 15 long- distance routes. Over the past 20 years, Amtrak’s annual ridership has increased by 49% from 21.2 million passengers in 1994 to 31.6 million passengers in 2013. The strongest gains have come from short-distance routes, which have collectively grown by 175%. Today, the most traveled short-distance routes run through dense urban centers on the west and east coasts. Short-distance routes vary greatly in overall ridership, on-time performance, distance, and cost recovery. Northeast Corridor ridership (not including the discontinued New York to Philadelphia Clocker) has risen by 44% since 1994. Local Northeast Regional service has grown by 36% over the past 20 years from 5.9 million riders in 1994 to 8.0 million riders today. Metroliner and Acela Express service has grown by over 65% in the same time period from 2.0 million riders in 1994 to 3.3 million riders today. Long-distance service has grown by 17.5% since 1994 with an average annual ridership per route of 315,000 passengers.
While state-supported short-distance routes have dominated ridership growth over the past 20 years, the Northeast Corridor has led overall ticket revenue growth for Amtrak during the same period of time. In 2013, Northeast Corridor revenues totaled $1.1 billion (up 5.3% from 2012) with $530.8 million in ticket revenues coming from Acela service (up 4.5% from 2012) and $568.7 million in ticket revenues coming from Northeast Regional service (up 6.2% from 2012). These revenues accounted for nearly 50% of Amtrak’s overall ticket revenues of $2.1 billion, despite coming from only 35% of Amtrak’s total ridership. State-supported short-distance revenues totaled $478.1 million in 2013 (up 4.4% from 2012), and long-distance revenues totaled $525.9 million (up 1.9% from 2012). In 2013, ticket revenue accounted for approximately 70% of Amtrak’s total revenue of $3.0 billion. Other sources of revenue came from food and beverage sales, state-supported train revenue, freight access fees, and commercial development.
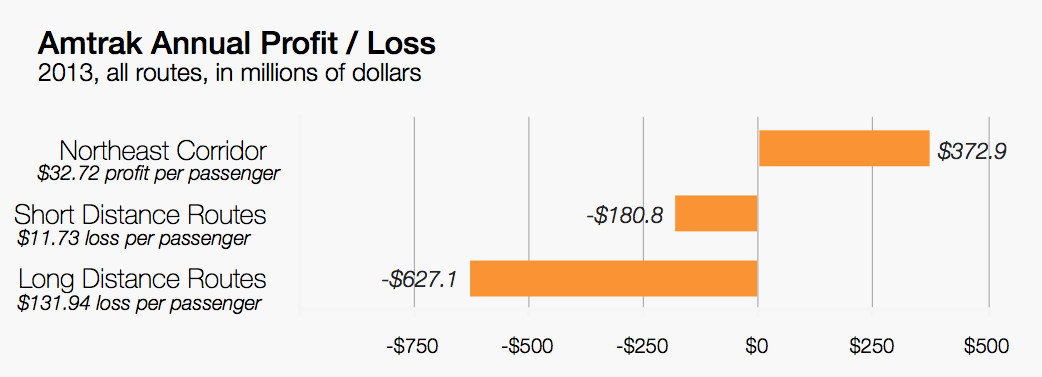
In 2013, Amtrak’s total expenses amounted to $4.2 billion. $2.1 billion or 50% of Amtrak’s total expenses in 2013 came from salaries, wages, and benefits. Employee benefit expenses, including retirement, unemployment, medical, and disability benefits, totaled $702.9 million, or 35%, of Amtrak’s 2013 employee expenses. Other large expenses included train operations, fuel and power, material costs, and communications. By sector, the Northeast Corridor was the only line in 2013, or at any time during the past 20 years, that made a profit. The Acela Express accounted for $236.9 million, or 63% of Amtrak’s total operational profits, while Northeast Regional service accounted for $133 million, or 36% of Amtrak’s total operational profits. The only other profitable lines in 2013 were select short-distance routes including the Adirondack, Washington-Lynchburg service, and Washington-Norfolk service. Collectively, these routes accounted for $4.5 million, or 1% of Amtrak’s total operational profits. Non-designated Northeast Corridor and short-distance routes brought in other non-substantial profits as well. As a whole, state-supported short-distance routes lost $180.8 million in 2013, or $11.73 per passenger, at an average cost recovery per route of 82%. Long-distance routes fared substantially worse, losing $621.7 million in 2013, or $131.94 per passenger. Long-distance lines averaged a cost recovery per route of 48% and accounted for nearly 80% of Amtrak’s total ticket losses for 2013.
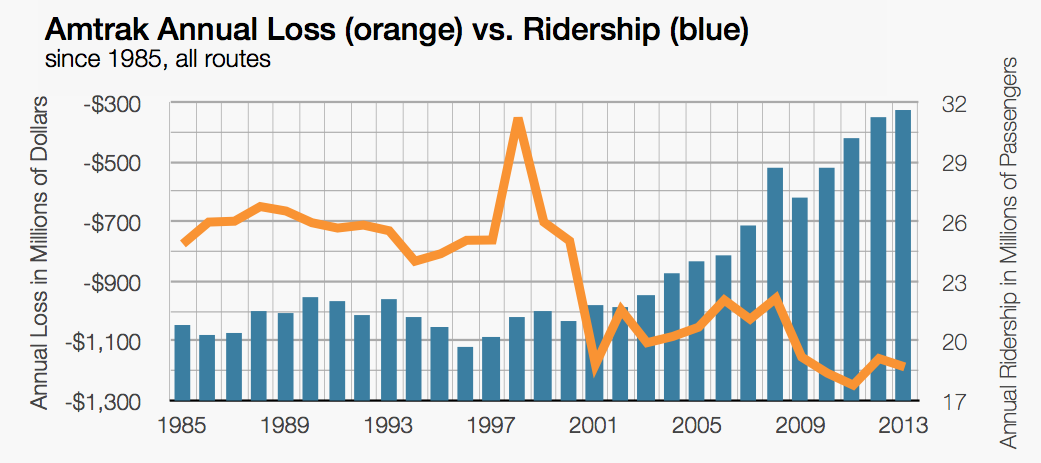
Despite tremendous ridership gains over the past few decades, Amtrak’s annual losses have continued to rise, even as profits from the Northeast Corridor reach record highs. In the late 1980s and early 1990s, Amtrak’s deficits remained relatively stable at around $700 million before declining to a then record $1.18 billion loss in 2001. As ridership rose dramatically in the early 2000s, deficits decreased temporarily before reaching a new record loss of $1.25 billion in 2011.
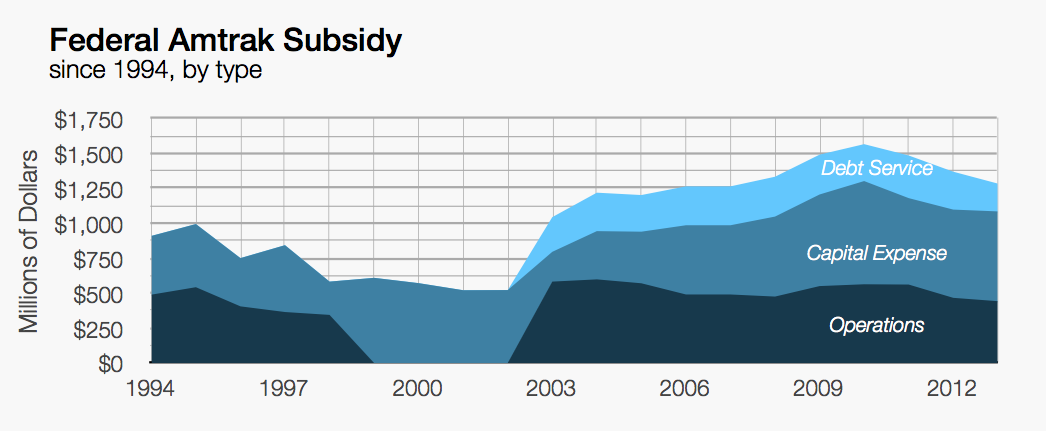
Since its formation, Amtrak has always relied on significant annual federal subsidies to remain solvent. Over the last 20 years, these subsidies have ranged from a low of around $500 million in 2002 to a high of over $1.5 billion in 2010. In 2013, Amtrak’s total federal subsidy of $1.37 billion included an operations subsidy of $442 million, a capital expense subsidy of $642 million, and a dedicated debt service subsidy of $199 million. In addition to Amtrak subsidies, Congress has appropriated nearly $13 billion in additional federal funding for Amtrak-related projects since 1994.
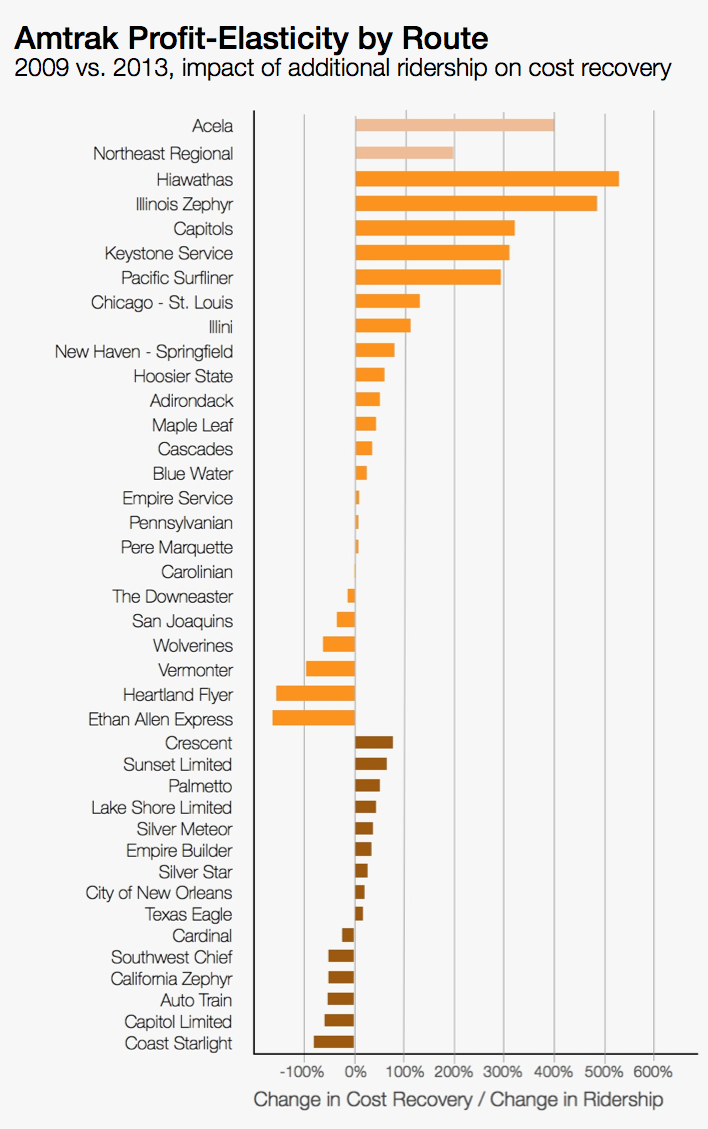
Even though Amtrak has seen ridership, revenue, and even profit growth throughout its system, it is still, by almost any economic measure, a failing business. Amtrak continues to bleed money even though its most successful routes have seen record ridership and revenues. Amtrak’s inability to reap the economic benefits of its apparent success is due to both the number of unprofitable routes that overwhelm its profitable routes as well as the inelasticity of Amtrak’s cost recovery in comparison to its ridership growth. Overall, 90% of Amtrak’s routes lose money. This leaves Amtrak’s few profitable routes, including those on the Northeast Corridor, to fund the losses on not only the unprofitable routes, but also capital expenditures throughout the entirety of the system. In other words, a business traveler buying a ticket from Washington to Philadelphia is paying a portion of her fare to repay losses along cross-country routes and fund infrastructure improvements throughout the entire country. Making matters worse, many of the unprofitable routes that are responsible for Amtrak’s largest operational losses are unable to make money even if they reached maximum capacity ridership. For example, over the past five years, every Amtrak route has increased ridership by some margin. Still, a quarter of these routes managed to post greater losses in 2013 than in 2009 despite increasing both ridership and ticket revenue. Further, another 25% of Amtrak’s routes only slightly reduced their deficits despite gaining ridership and revenue. As partisan politics threaten Amtrak’s already unstable annual federal subsidy, the ability of Amtrak to recoup losses and finance capital expenditures using excess revenues generated from just a handful of profitable routes is not only undesirable, but also uncertain.